March 19, 2025
Version 1.48 of the Multi Channel oscilloscope software is now available for download.
A lot of changes have been made to add new functionality and to improve basic operations in the software. This is a categorized overview of some of the changes.
Contents
Schematic drawing measurement setups
The Object Tree can now also be switched to a schematic representation. It then shows all available objects like instruments, graphs, meters, I/Os etc. in a schematic representation, using blocks for all objects. All connections between inputs and outputs are shown as well. Where possible, the same color for the connections is used as the corresponding signal lines in the graphs.
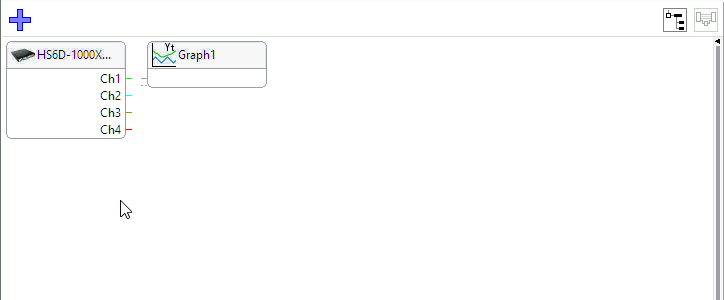
In the Object schema you can add and remove objects and make connections between inputs and outputs of objects, by dragging lines between outputs and inputs. That allows to perform the required calculations on the measured data and to display the data in meters and graphs.
More information can be found at the Object Schema page.
Standalone measuring
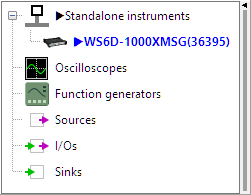
With versions of the WiFiScope WS6 - 1000XM with option L, it is possible to perform standalone measurements. Once the instrument is setup and measuring is started, it no longer requires a connection to the computer to perform measurements. The software can be closed and the computer can be used for another task. As long as the instrument is provided with power, it will perform measurements, which are stored on an internal solid state disk.
When the instrument is operating standalone, the software can connect to it, to download and view saved measurements, to send notifications when e.g. a measurement is performed. Meanwhile the instrument will remain performing measurements.
More information can be found at the Standalone measuring page.
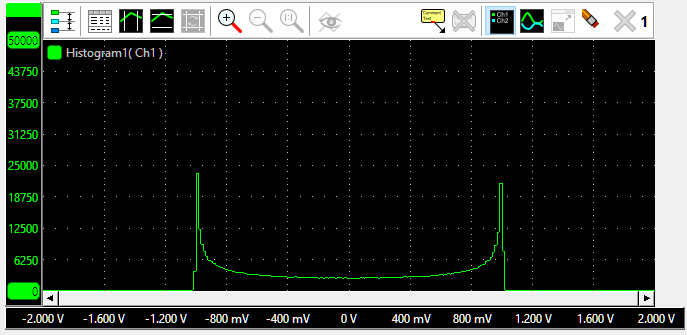
New Histogram I/O

More information can be found at the Histogram I/O page.
New Power Spectral Density I/O

More information can be found at the Power Spectrum Density I/O page.
New units for Logarithmic presentations
Several new units have been added for logarithmic representation of signals. A logarithmic (vertical) axis in a graph can now be set to the following units:
- dB
- dBV
- dBmV
- dBµV
- dBµV/m (at 10m)
- dBm
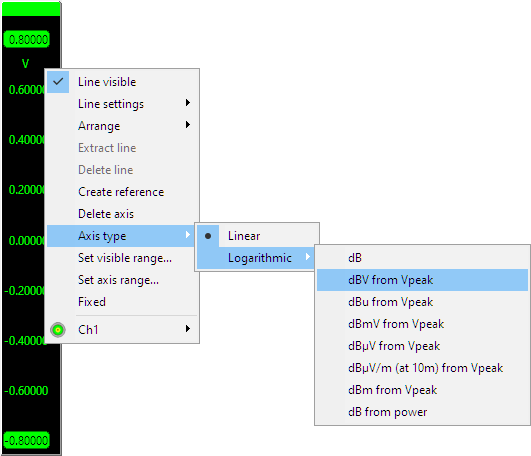
The Log I/O now has corresponding presets.
Other changes
Several other improvements and additions are made to the software. The most important are:
-
Graphs:
- Added a new type of domain, Bin. This to display bin-ed data from e.g. a Histogram. This data normally has other unit than 's' or 'Hz'.
- Fixed exporting FFT data between vertical cursors.
- Fixed access violation in graph when toggling between Yt and XY mode.
- Fixed not changing cursor window type when toggling graph mode.
- Fixed access violation when closing a second graph with cursor window open.
- Added UART 3.3 V and 1.8 V presets for UART / Serial decoder I/O.
- Added copy to clipboard button to XY cursor window.
- Fixed RMS I/O stopping after handling 2147483648 (= 231 + 1) samples in streaming mode.
- Fixed not correctly restoring visible range of logarithmic horizontal axis on load.